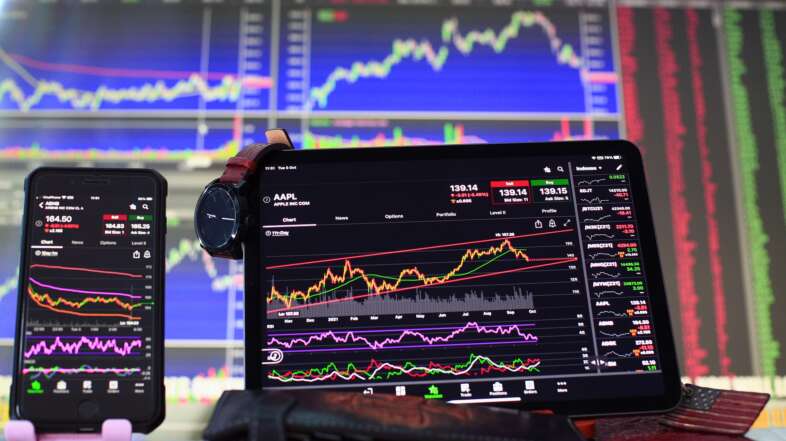
Charts in trading visually represent historical prices that allow traders to observe and analyze the history of security’s trading prices, volume, and market sentiment. You can use charts to make informed trading decisions based on this information. Types of charts There are many types of charts used in trading foreign securities. Candlestick charts Candlestick charts or Japanese candlesticks are graphed…
